So we have seen a strong rally last Friday. It was expected to hear some voices in forums discussing 'Bull is back to action'. Well, I have decided again to do some analysis on the trend. And this time, I want do something interesting.
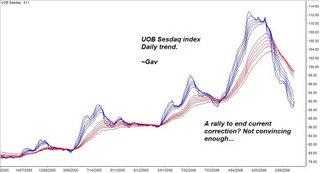
Firstly, I am looking at daily trend of UOB Sesdaq index. Last week's rally put a pause to the heavy selling. Short term moving averages are ticking up. However, it is still far below long term moving averages. And there is, in fact, nothing much in term of trend change. Downtrend is still intact.
From Directional analysis, negative sentiment is still hanging in the air, though it was ticking down at the end of last week, I do not see positive sentiment gaining strength.
(Click on the chart to maximize it)
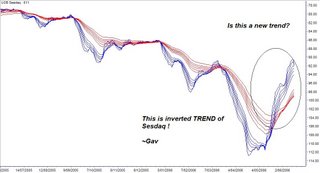
If it is a little bit tough for trader to accept establishment of downtrend (Since, most of traders only recognize Bullish pattern), I have inverted the daily trend of UOB Sesdaq. The inverted trend indeed showing me a 'BUY' opportunity (in reality, a SELL, remember, this is a inverted chart) if I were to do
trend trading.
In fact, I am not impressed by the rally. Maybe, at least for now. My strategy will be sell on strength instead. The rally in some way, provides a chance to let go current holding of small cap.
 So we have seen a strong rally last Friday. It was expected to hear some voices in forums discussing 'Bull is back to action'. Well, I have decided again to do some analysis on the trend. And this time, I want do something interesting.
Firstly, I am looking at daily trend of UOB Sesdaq index. Last week's rally put a pause to the heavy selling. Short term moving averages are ticking up. However, it is still far below long term moving averages. And there is, in fact, nothing much in term of trend change. Downtrend is still intact.
From Directional analysis, negative sentiment is still hanging in the air, though it was ticking down at the end of last week, I do not see positive sentiment gaining strength.
(Click on the chart to maximize it)
So we have seen a strong rally last Friday. It was expected to hear some voices in forums discussing 'Bull is back to action'. Well, I have decided again to do some analysis on the trend. And this time, I want do something interesting.
Firstly, I am looking at daily trend of UOB Sesdaq index. Last week's rally put a pause to the heavy selling. Short term moving averages are ticking up. However, it is still far below long term moving averages. And there is, in fact, nothing much in term of trend change. Downtrend is still intact.
From Directional analysis, negative sentiment is still hanging in the air, though it was ticking down at the end of last week, I do not see positive sentiment gaining strength.
(Click on the chart to maximize it)
 If it is a little bit tough for trader to accept establishment of downtrend (Since, most of traders only recognize Bullish pattern), I have inverted the daily trend of UOB Sesdaq. The inverted trend indeed showing me a 'BUY' opportunity (in reality, a SELL, remember, this is a inverted chart) if I were to do trend trading.
In fact, I am not impressed by the rally. Maybe, at least for now. My strategy will be sell on strength instead. The rally in some way, provides a chance to let go current holding of small cap.
If it is a little bit tough for trader to accept establishment of downtrend (Since, most of traders only recognize Bullish pattern), I have inverted the daily trend of UOB Sesdaq. The inverted trend indeed showing me a 'BUY' opportunity (in reality, a SELL, remember, this is a inverted chart) if I were to do trend trading.
In fact, I am not impressed by the rally. Maybe, at least for now. My strategy will be sell on strength instead. The rally in some way, provides a chance to let go current holding of small cap.
3 comments:
Agree, market general trend does not change at all. But a technical rebound has started and is ongoing.
Pls note that even if in a downtrend or bear market, there are bouts of rebounds, shorter term averages tend to converge with longer term averages (see your 2nd chart) if the former is too distant from the later one, which is the case in the current market, an oversold one.
I noticed that about 60 stocks on my radar screen had formed small double bottoms and broke above db necklines. Some of these breakouts are supported by heavy volumes, especially for some China plays. What does this mean? Seems the market is mature for a relief rally or a sucker rally as mentioned on my blog.
China plays may lead this rebound until shorter term averages converge with the longer term avearges, resistance of this rally. Most stocks may have abilities to rebound about 50% of total fall from high.
I agree with the relief rally theory. I provides punter or short term trader opportunity to profit from it. If you were to do trend trading, this is not the time. That's what I am doing. I will only be interested when trend is established.
I would have to moderate comment posted on my site due to some spam advertising activity I have encounter recently. So some comment might not appear immediately after posting. I will approve the comment as soon as I open my mailbox.
Post a Comment