 This is trend analysis of daily chart of STI. Downtrend is still intact, though there was rebound at the end of last week, that did not help much in term of trend change. There is no sign of recovery. Directional analysis wise, there was a slight up turn in directional element, however, it is still below trigger line. Negative sentiment is still dominating.
No reason to consider any BUY for now.
This is trend analysis of daily chart of STI. Downtrend is still intact, though there was rebound at the end of last week, that did not help much in term of trend change. There is no sign of recovery. Directional analysis wise, there was a slight up turn in directional element, however, it is still below trigger line. Negative sentiment is still dominating.
No reason to consider any BUY for now.
Sunday, June 11, 2006
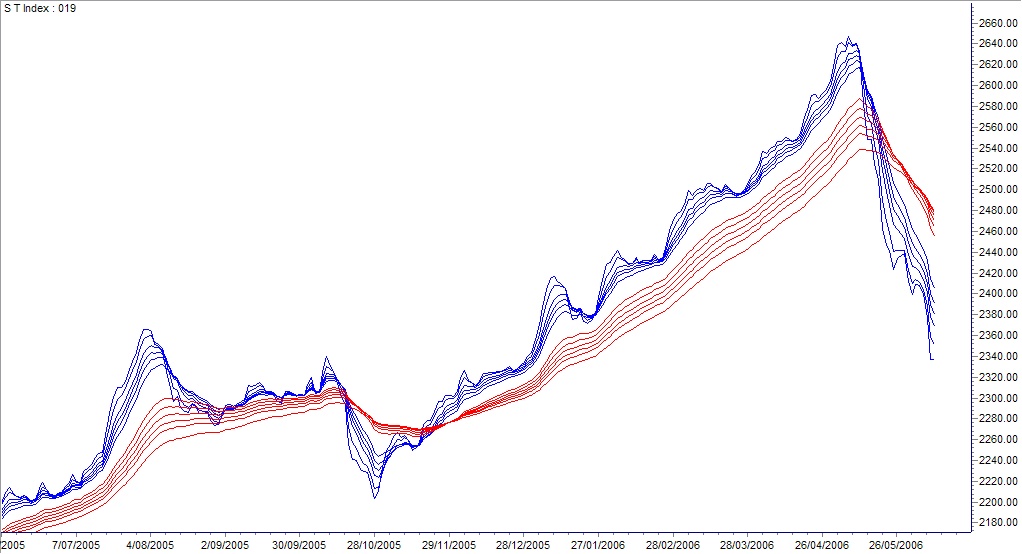
Chart Eye: STI daily chart : Ended 09-June-2006
This is trend analysis of daily chart of STI. Downtrend is still intact, though there was rebound at the end of last week, that did not help much in term of trend change. There is no sign of recovery. Directional analysis wise, there was a slight up turn in directional element, however, it is still below trigger line. Negative sentiment is still dominating.
No reason to consider any BUY for now.
Subscribe to:
Post Comments (Atom)
No comments:
Post a Comment