| Intraday trend | Mini Dow | Gold Futures |
| Intermediate term | Down | Up |
| Short term | Down | Up |
| Recent High | 11026 | 644.5 |
| Recent Low | 10826 | 621.2 |
Friday, July 21, 2006
Day trading II : 21-Jul-2006
Looks like we have some action in the futures market today. Here is the summary of current intraday trend during market open.


Chop! 21-Jul-2006
Well, just as expected in the morning, we had a choppy , boring trading day in SG futures market. No trade was done.
Looking at volume of SIMSCI, I can fully understand why major oversea broking house like Interactive Broker does not bother to offer customers to trade. With just around 2000 contracts traded in a trading day. I guess, there is still long way to go to promote SIMSCI futures trading. I do not incline to relate this to market condition, it is just a matter of industry interest over this product.
Alrite, result reviewed. I got my first negative week. Making two losses in the the first two days of the week, and subsequently caught up by some personal works or did not see rewarding trading opportunity.

Day trading 21-Jul-2006
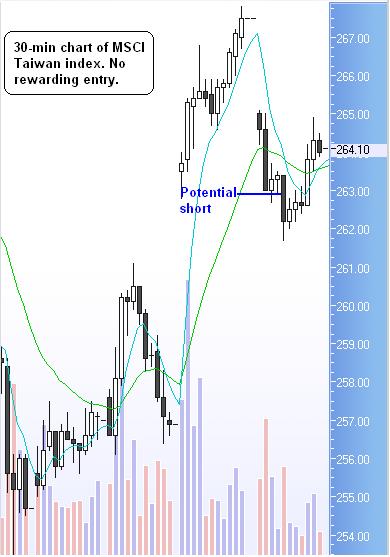
I will have to attend a meeting, no trading in the morning. Anyway, here is the view of this morning's market.
It looks like we are going to have a choppy day.
| Intraday trend | MSCI Taiwan Index Futures | MSCI Singapore Index Futures |
| Long term | Lateral | Lateral |
| Intermediate term | Lateral | Lateral |
| Short term | Lateral | Down |
| Recent High | 267.8 | 284.4 |
| Recent Low | 262.8 | 276.8 |
Thursday, July 20, 2006
No trade 20-Jul-2006
No trade was taken today, given the big gap up this morning, there was no riskwarding opportunity to enter SG futures market. Apparently, today might be a good day to do some puntings in SG stocks market. That's not my game.
My trading performance seems to be stalled. I gotta do something to get out of the current situation.
Day trading 20-Jul-2006
We have 3-digit gain , over +200 points in DJ last nite. It is likely to have some bullish hangover in Asian markets. SIMSCI volume is building up in the first half an hour, though it is still not impressive. Chart wise, I would prefer SIMSCI over TIMSCI for day trading today. I will be looking at Long only for this morning.
Here is the summary
| MSCI Taiwan Index Futures | MSCI Singapore Index Futures | |
| Longer term | Down | Lateral |
| Medium term | Up | Up |
| Short term | Up | Up |
| Recent High | 265.9 | 287.1 |
| Recent Low | N.A | N.A |
Wednesday, July 19, 2006
Lecture notes series: Percent Risk Model
I developed a habit of writing down whatever I learnt, this helps me to 'burn' the information into my mind. I did this during my school time as well. I decided to jot down what I have read from books so far in Lecture Note series. As mentioned in my previous posting, I am following Percent Risk Model for my position sizing. Of course, this is not the only model available, it is just the approach I applied in my business. I have amended the approach to suit my style. Basically, I will define initial stop level base on chart. It can be support/resistance level, straight trend line, Count back line or swing high/low.
Definition:
RISK - the point at which I will get out of the position in order to preserve my capital. It is x percent of my trading equity, for example, I will risk not more than 2% of trading equity in any trade.
Percent Risk Model - Controlling my position size as a function of the risk.
For example, with account size of $50,000, 2% of $50,000 is $1000. That means in any trade, I shall not risk more than $1000 with this account size.If I got a Long signal for SIMSCI at 289 and I have figured out from chart, proper stop loss level is at 287.5. On one contract basis, this trade requires $300 risk. With maximum risk amount $1000 available to me, I will be able to buy ($1000/$300=3.33) 3 contracts in this trade.
I quote a portion of Dr. Van Tharp's explaination from his book
'Just how much risk should you accept per position with risk position sizing? Your overall risk using risk position sizing depends upon the size of the stops you've set to preserve your capital and the expectancy of the system you are trading.'
Here goes on the explaination :
'if you are trading other people's money, you probably should risk less than 1 percent per position. If you are trading your own money, your risk depends upon your own comfort level. Anything under 3 percent is probably fine, if you are risking over 3 percent, you are a "gun-slinger" and had better understand the risk you are taking for the reward you seek.'
He explained the relationshiop with system expectancy as well:
'if you have high expectancies in your system (i.e your reliability is above 50% and your reward to risk ratio is 3 or better), then you can probably risk a higher percentage of your equity fairly safely'.
The percent risk model is the first model that gives trader a legitimate way to make sure that a 1-R risk means the same for each item he is trading. The advantage of this model is, it allows both large and small accounts to grow steadily. It equalizes performance in the portfolio by the actual risk. On the other hand, the disadvantage will have you to reject some trades because they are too risk.
Trading Business plan 101
I have been doing some thinking and studies over the past weeks. I had some good days and some bad days over the past 2 months. Well, I guess, I'd better figure out the details of managing the trading business while I am still in nice profitable situation rather than searching for 'holy grail' for survival after hitting losing streaks. At least, mentally, I am not under heavy stress now.
The R-multiple concept hits me well on the head. I have figured out the importance of it in order to survive in this business for long. Well, at least for now, this is the best approach that comes to my mind. I am currently following Percent Risk Model. I am not trading a million-dollar-sized account now. So, the objective now is to grow the account as soon, and as much as possible. Well said, tough job though. I am striving to improve and maintain my system with high expectancy and frequency of trade.
So the first thing in the morning is to figure out how much I am going to risk and position size to be taken for the day.
This is second thing I will be doing every morning before start of a new trading day. Basically, the idea is not to go against the trend. Some profitable movements in short term might be missed out, however, I would prefer to go along with the trend for long term survival.The time frame are only refering to intraday trend of the day. I am not looking at longer time frame like daily , weekly or monthly. This is shuold simplify my job during the trading day where I will be only concentrating on the last thing of trading - entry and exit point.
This is for my day trading business. Nothing fancy. The last thing I will say in this entry : " Hey, Don't Buck the trend - lah"
| MSCI Taiwan Index Futures | MSCI Singapore Index Futures | |
| Longer term | Down | Down |
| Medium term | Lateral | Lateral |
| Short term | Up | Up |
| Recent High | ||
| Recent Low |
Futures trading 19-Jul-2006
It is likely to see a choppy trading day for MSCI Taiwan and potential Long opportunity for SIMSCI, though I would prefer to confirm this after getting more signals, it might end up with choppy style as well. It is earning session again, let's see how far can SIMSCI go.
I will not trade in the morning given some last minute meeting to attend.
Tuesday, July 18, 2006
Market recap 18-Jul-2006
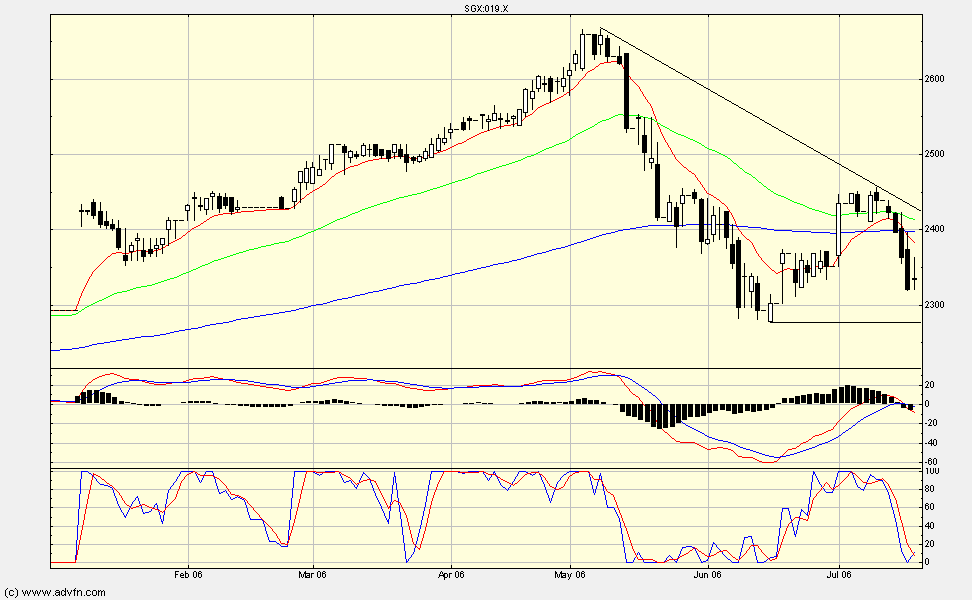
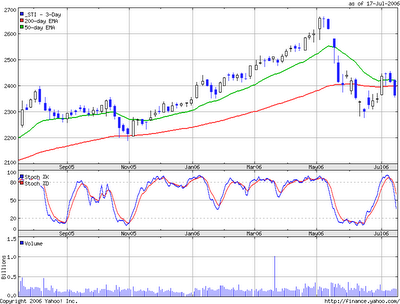
STI closed higher? Ok, it did. It closed higher than yesterday. Good news, it is still below 12-day, 50-day and 200-day EMA. I see some space to move towards recent low, which is 2277 aread.
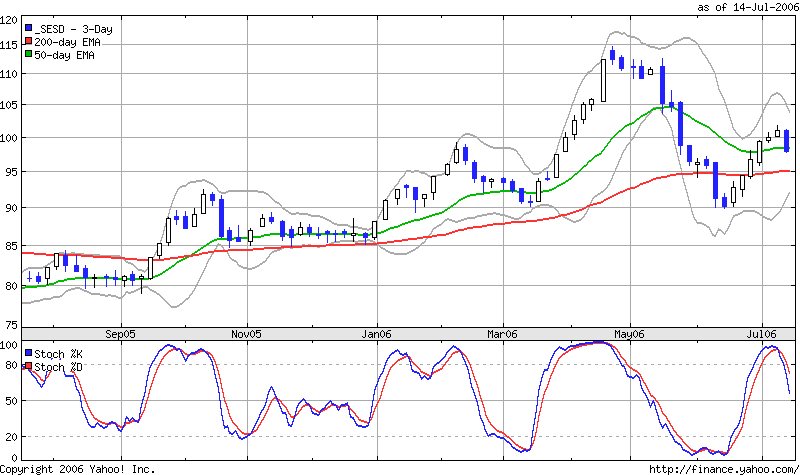
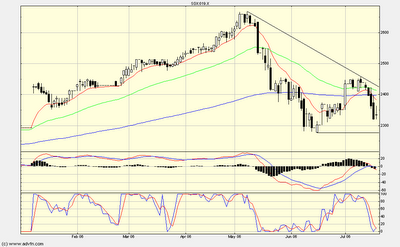 Nothing much about UOB Sesdaq. Still ding-dong between 50-day and 200-day moving averages. Just be patient to watch for development during this result relaesing season. Recent low is around 90 area. I am interested in looking at Short side if the support area is broken.

 Nothing much about UOB Sesdaq. Still ding-dong between 50-day and 200-day moving averages. Just be patient to watch for development during this result relaesing season. Recent low is around 90 area. I am interested in looking at Short side if the support area is broken.

RE: TIMSCI 18-Jul-2006: Short trade closed
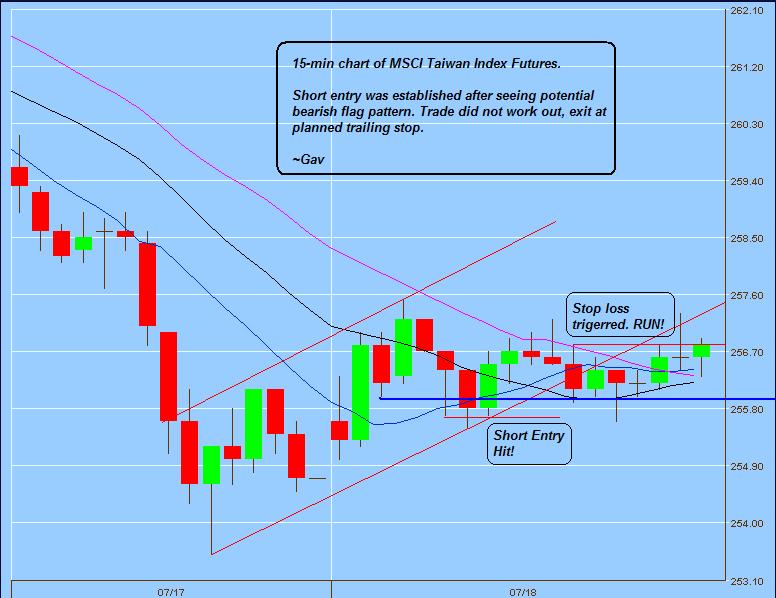 It seems like things were not going so well with me this week. Yup, another losing trade today. Short position of TIMSCI was established at 255.6, stop loss has been moved accordingly and it was triggered at 256.8 at the last trading hour of MSCI Taiwan Futures for the day. It seems to be a strong intraday support at 256.5 area. Even with -300 points loss in Nikkei, TIMSCI was still holding well. Is this a force of rebound after previous days' losses? No idea.
Anyway, there is nothing much I can do other than exit the trade if things are not working in my favour. One trade closed with -1.2 point loss (-0.89R).
This should be the only trade of the day. I will be spending my time reading for the rest of the day.
It seems like things were not going so well with me this week. Yup, another losing trade today. Short position of TIMSCI was established at 255.6, stop loss has been moved accordingly and it was triggered at 256.8 at the last trading hour of MSCI Taiwan Futures for the day. It seems to be a strong intraday support at 256.5 area. Even with -300 points loss in Nikkei, TIMSCI was still holding well. Is this a force of rebound after previous days' losses? No idea.
Anyway, there is nothing much I can do other than exit the trade if things are not working in my favour. One trade closed with -1.2 point loss (-0.89R).
This should be the only trade of the day. I will be spending my time reading for the rest of the day.
Futures trading 18-Jul-2006
After watching first half an hour action of TIMSCI (MSCI Taiwan), SIMSCI and Nikkei futures, I will be interested in looking at Short side of TIMSCI. Nikkei Futures is losing more than -200 points, it is a little bit tough for me to be bullish.
SIMSCI is having some upward movement, however, I am not keen in Long, at least at this point of time. It is likely to be choppy (with light volume,very much possible). I will be reviewing the situation of SIMSCI in the later of the day.
Market recap 17-Jul-2006
It is not a nice picture for STI. It , in fact, failed to stay above 50-day moving average and closed below 200-day moving average. And it formed a lower high. It is a bit difficult for me to stay bullish. I would prefer to stay at Short side. In addition, looking at stochastics, it is yet to enter oversold zone.
 UOB sesdaq is on the line. It stays around on 50-day moving averages. It is likely for Sesdaq to ding-dong between 50-day and 200-day moving averages. Not so good for small cap, but I am not over bearish. I guess, a little bit patience is needed.

 UOB sesdaq is on the line. It stays around on 50-day moving averages. It is likely for Sesdaq to ding-dong between 50-day and 200-day moving averages. Not so good for small cap, but I am not over bearish. I guess, a little bit patience is needed.
RE: TIMSCI 17-Jul-2006: Short trade closed :chart
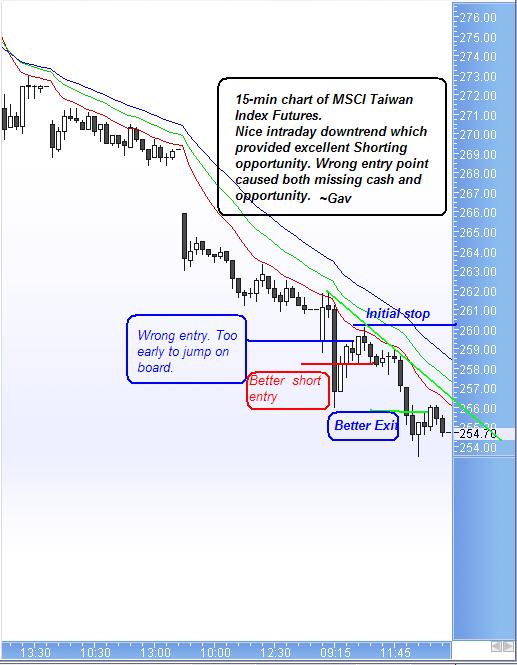 This is 15-min chart of MSCI Taiwan Index Futures (TIMSCI). It was easy to observe price set-ups were all for Short. I entered with entry and missing out good profit and taking silly losses.
I have been reading money management stuffs from Van Tharp and other web blogs. Thanks to TraderMike who has a well written entry on Position sizing. I am practising R-Multiples as introduced by Dr.Van Tharp for position sizing and evaluate my system expectancy.
Basically, the idea is to express all of my profits and losses in terms of my initial risk(R).
For example, if my risk for each trade is $300, then if I made $3000, then I have 10R gain. On the other hand, if I closed my trade with $150 loss, then I will have an 0.5R loss.
I learnt about the concept of expectancy. To make it simple, expectancy is the average amount you can expect to win(or to lose) per dollar at risk. Here is the formula:
This is 15-min chart of MSCI Taiwan Index Futures (TIMSCI). It was easy to observe price set-ups were all for Short. I entered with entry and missing out good profit and taking silly losses.
I have been reading money management stuffs from Van Tharp and other web blogs. Thanks to TraderMike who has a well written entry on Position sizing. I am practising R-Multiples as introduced by Dr.Van Tharp for position sizing and evaluate my system expectancy.
Basically, the idea is to express all of my profits and losses in terms of my initial risk(R).
For example, if my risk for each trade is $300, then if I made $3000, then I have 10R gain. On the other hand, if I closed my trade with $150 loss, then I will have an 0.5R loss.
I learnt about the concept of expectancy. To make it simple, expectancy is the average amount you can expect to win(or to lose) per dollar at risk. Here is the formula:
Expectancy= (Probability of Win x Average Win) - (Probability of Loss x Average Loss)
More on this topic in my future posting.
Monday, July 17, 2006
RE: TIMSCI 17-Jul-2006: Short trade closed
Short position of TIMSCI was established at 258.2. Initial stop was set at 259.8 which was subsequently triggered. One trade closed with -1.6 point loss which converted into -1.37R loss (uh! ugly). I should not have allowed the trade to be place since the initial risk was more than 1R. What was going on here? Second problem, I did not wait for lower high to form completely, the decision was made after looking at some candles (uh! stupid). This is a good but painful example to show how does a trade with correct setup, but wrong entry point can hurt my trading account. Ugly trade. Silly action.
In fact, there was another opportunity when a descending triangle was formed. I did not take the trade after making a -1.37R loss within a day. I decided to close the day with negative.
Chart will be posted later
Day trading for 17-Jul-2006
Day trading view:
TIMSCI is having some upward movement in an existing downtrend. I am not interested in chasing the bull. Instead, I am looking for opportunity to establish short position if the downtrend is not violated.
SIMSCI, bearish. Nice downtrend. It is likely to trade above 2,000 contracts in the first hour trading. I will be only looking at possible short position for today.
Sunday, July 16, 2006
Article read: Master the Four Fears of Trading
Ahead of another new week, here is an great article to prepare myself.
Master the Four Fears of Trading
Merriam-Webster's dictionary defines fear as "an unpleasant, often strong emotion caused by anticipation or awareness of danger, going on to explain that fear...implies anxiety and usually the loss of courage." This definition of fear is useful in helping define the issues that traders face when coping with fear. The reality is that all traders feel fear at some level, but the key is how we prepare to address our concerns related to taking on risk as a trader. In this article I will review four major fears experienced by traders, and I'll take it a step further by noting how the outcomes of these fears create undesirable trading behaviors. Basically, my aim is to have you walk away with an understanding of these dangers so you can and implement strategies that will address your fears and let you get on with your trading plan........
Full article can be found at bigtrends.com
Friday, July 14, 2006
TIMSCI 14-Jul-2006: Short trade closed: Chart
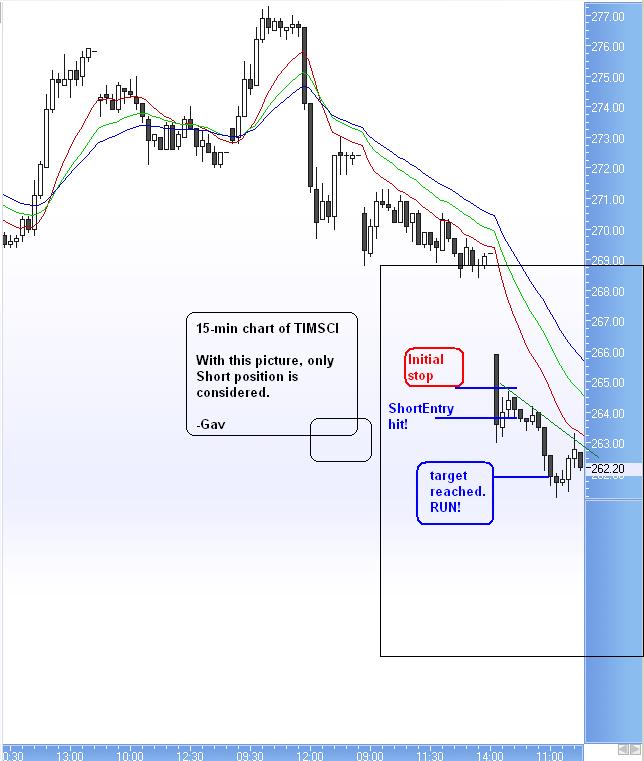 This is 15-min chart of MSCI Taiwan index Futures (TIMSCI). Nice downtrend setup and short entry. No trade for the rest of the day.
Though I was having two losing days in this week, I manage to close the day and the week in positive note.
This is 15-min chart of MSCI Taiwan index Futures (TIMSCI). Nice downtrend setup and short entry. No trade for the rest of the day.
Though I was having two losing days in this week, I manage to close the day and the week in positive note.
RE:MSCI Taiwan index futures (TIMSCI) 14-Jul-2006: Short trade closed
TIMSCI short position of 263.8 is covered at 262.1 which was a planned target. In fact, a descending triangle was formed. and the calculated target for descending triangle was around 262 as well.
I might missed out bigger profit, however, I would prefer to take profit based on planned target level.
One trade closed with + 1.7 points (1.26R) gain.
Chart will be posted after market closed.
MSCI Taiwan index futures (TIMSCI) 14-Jul-2006: Short position
From 15-min chart, downtrend is established. MSCI Taiwan index futures (TIMSCI) is trading below 12-p, 21-p and 30-p EMA. I am only looking for SHORT position. Short position has been established at 263.8. I have removed all indicators but moving averages to keep myself clear and focus on price action and trend only. I do not expect this decision to deteriorate trading performance. Though I would say, I am still practising this approach. Intraday support area is found at area of 262.
I do not trade SIMSCI futures today, given first hour volume is only around 1,500 contracts traded.
Trading for 14-Jul-2006: Potential shorts
Great. Another 3-digit loss in DJ last nite. :-) From the intraday trend perspective, I would be only looking at SHORT for today. For Nikkei futures, MSCI Taiwan, and MSCI Singapore. This is trade setup. My job now is looking for entry and stop points. I hope the market doesn't run away without me.
I was reading Maxian.com yesterday. I got a feeling of being slapped on the face. I have been complicated my analysis unnecessary. The basic of trading should 'Buy it when it is going up, sell it when it is going down.' Though this statement is too loose in term of trading entry, it basically tells me, looking at bigger picture, looking at the trend, trade the direction of the market, as simple as that.
I quote a paragraph from Maoxian.com
'The wrong way to play it would be to attempt to "pick a bottom," or fade the market; blindly enter short without waiting for a good spot; getting short without setting a stop, etc. The list of errors goes on and on, but people mainly make those three big mistakes.
Traders who know themselves, who have common sense, who are disciplined, and who have the ability to keep it simple will do just fine. Remember that many people in the market are either uneducated or uninformed. And most of the few who are educated and informed waste their time building "scenarios" and end up defeating themselves by trying to outsmart the market. '
Trading should be simple. Really, it should be.
Subscribe to:
Posts (Atom)